Options Open Interest Analysis
See where positioning concentrates at every strike and expiry, to understand the levels the market defends.
What is Open Interest
Open Interest is the number of options contracts that are open and not yet closed at a given strike and expiry. Unlike volume, which counts the day's trades, Open Interest snapshots accumulated positioning: where exposure has actually been built.
Reading the distribution of Open Interest by strike helps identify key levels: large call and put accumulations often line up with support and resistance, with expiry targets, and with the points where market-maker hedging becomes most relevant.
Gaudio OTT shows Open Interest in real time across all indices, ETFs and stocks that have options and on futures such as ES and NQ, by strike and by expiry, so you can separate established positioning from intraday moves and read the picture the way professionals do.
How to read Open Interest
Open Interest rises when new contracts open (both buyer and seller are new) and falls when contracts close: so it doesn't measure how often a strike trades, but how much exposure remains outstanding. That's why it complements volume — volume tells you where the fight happened today, Open Interest where there's still an open position.
The useful read is not the total but the distribution by strike and expiry. A large call accumulation at a strike means a lot of long-call exposure rests there: as price approaches, the market makers who sold those calls must hedge, and that flow can slow or repel the move. The same, mirrored, applies to large put accumulations.
Comparing Open Interest across expiries shows where the market positioned short term (0DTE, weekly) versus medium-long (monthly and beyond), helping separate levels that matter for the session from those that structure the trend.
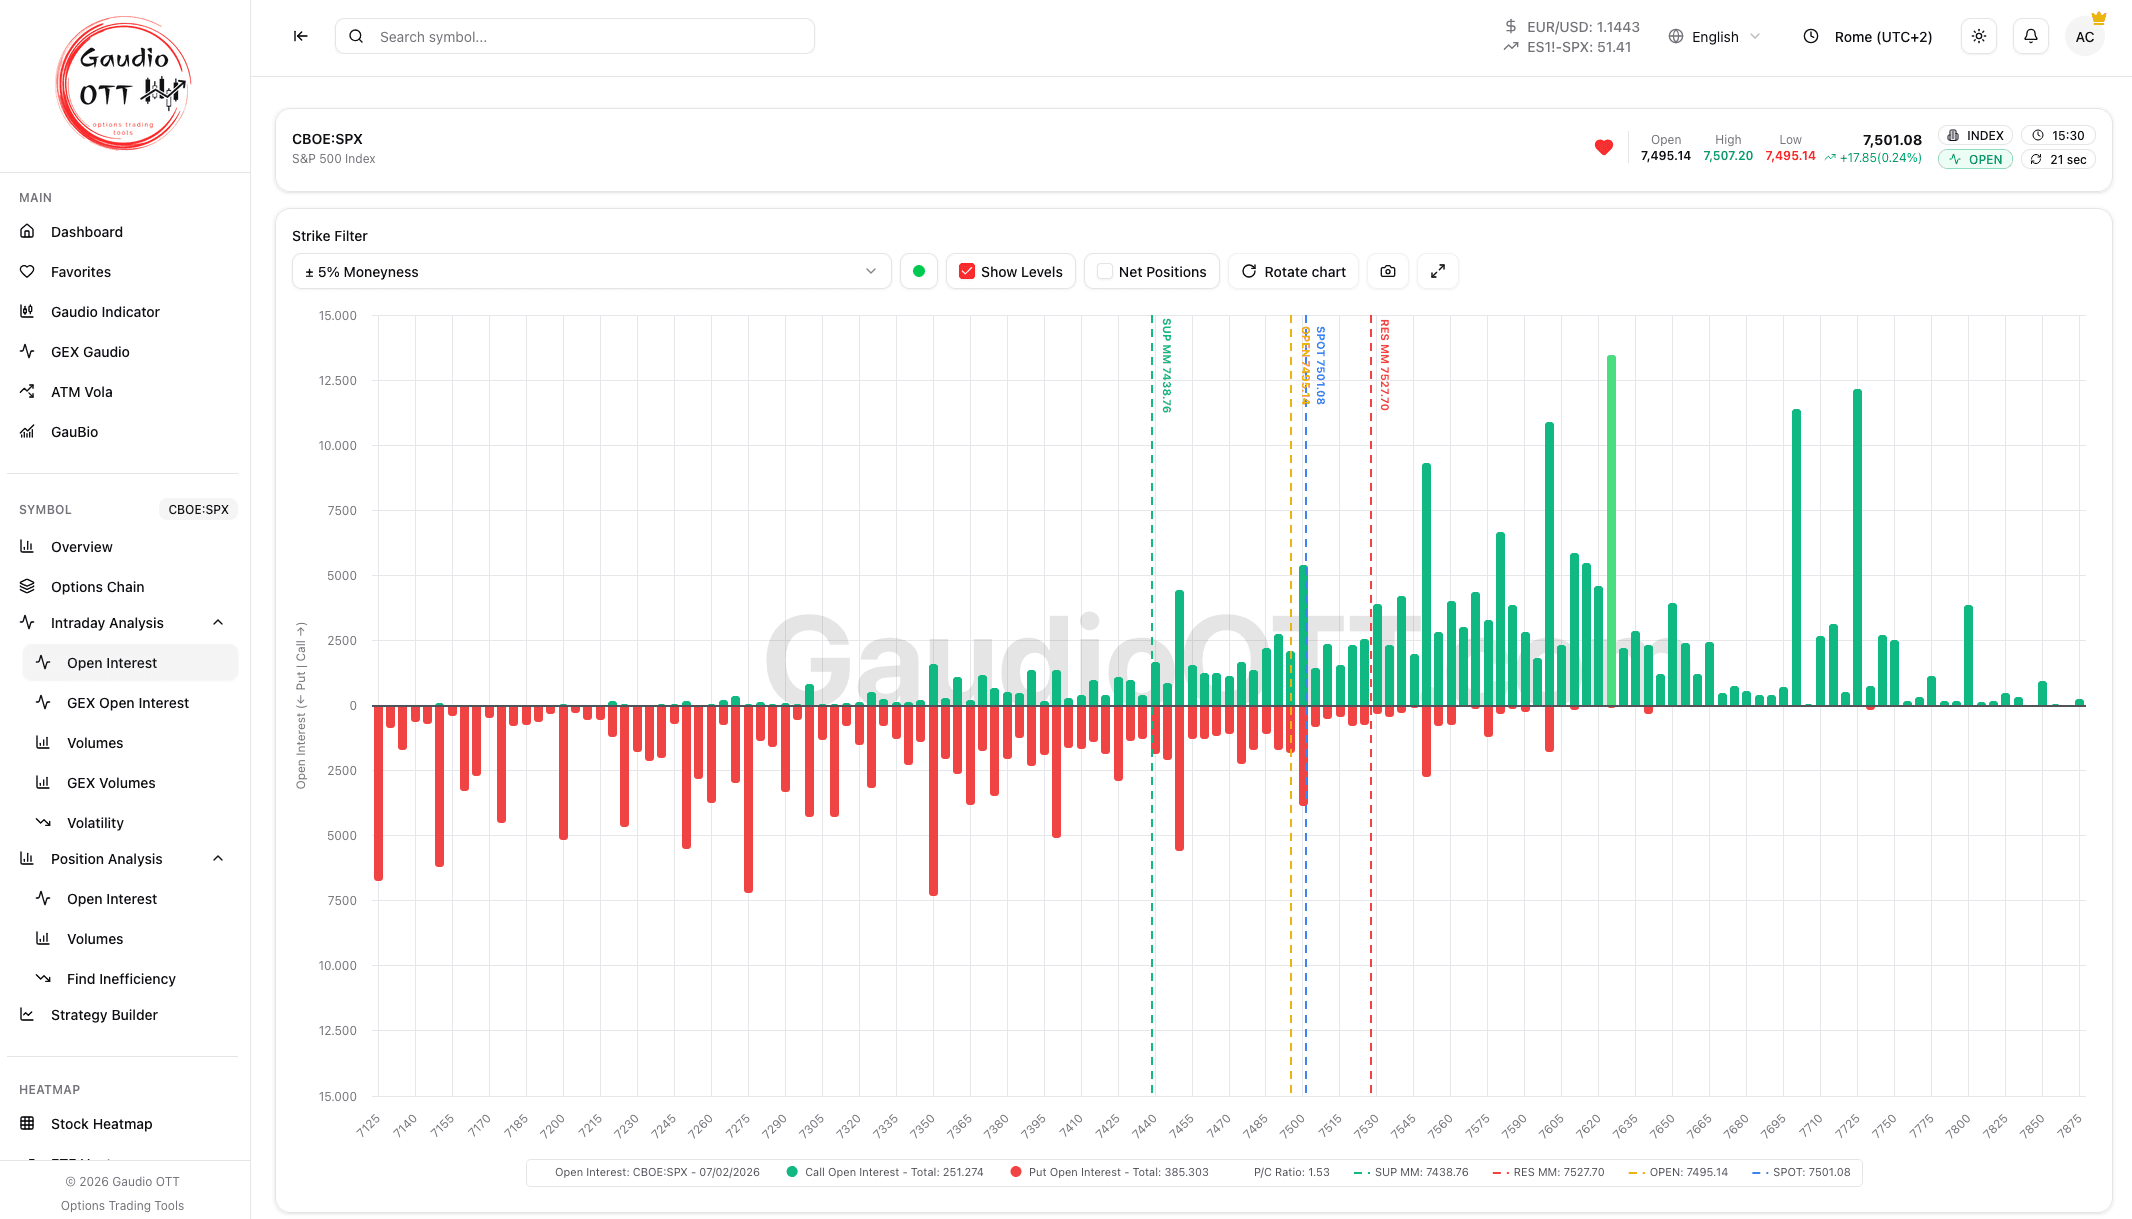
Open Interest distribution by strike and expiry
How Gaudio OTT helps
Positioning by strike and expiry
Visualize where Open Interest concentrates to identify the levels the market treats as important.
Big money and defended levels
Spot call and put accumulations that often act as support, resistance or expiry targets.
OI and volume together
Compare structural positioning with intraday flow to tell whether key zones are shifting.
Indices, ETFs, stocks and futures
Data on every index, ETF and stock with options and on futures such as ES and NQ, ready to use as trading references.
How to use Open Interest in trading
Expiry targets
The strikes with the maximum Open Interest for a given expiry are natural magnets the price tends to converge toward in the final hours before settlement: use them as targets.
Structural supports and resistances
Large put accumulations below price often act as support (dealers long put hedge by buying dips); large calls above act as resistance. Map the levels before you trade.
Confirm or deny technical levels
A classic support that lines up with a large put Open Interest is more robust than one without positioning. If a technical level has no Open Interest defending it, it's more vulnerable.
Read rebalancing
If Open Interest at a historical key level drops sharply between expiries, the market is unwinding that level: expect less price reactivity there going forward.
What makes Gaudio OTT's Open Interest different
Most tools show Open Interest only on the major indices or a narrow subset. Gaudio OTT expands it to every index, ETF and stock with options and to futures such as ES and NQ, by strike and by expiry, and always pairs it with intraday volume: so you see not only where there's position, but also where new flow is forming.
On futures such as ES and NQ, Open Interest covers the strikes near the price, about ±3% on ES, and the page always states the covered band: you know how far the data reaches, and never mistake a gap for an empty level.
Open Interest frequently asked questions
Related topics
AI Options Scanner
Two intelligent scanners — AI Suggestions on the symbol you're analyzing and the Opportunities Scanner on the entire US market — analyze thousands of contracts in real time across stocks, ETFs and futures, and show you only the trades with the best risk/reward profile.
GEX / Gamma Exposure
Two GEX tools — on open interest and on volume — for SPX, NDX, ETFs and stocks with options, plus the proprietary GEX Gaudio for intraday trading.
0DTE SPX
Dance Gaudio shows the volume of SPX options expiring today traded in the last minutes, strike by strike: the CALL level and the PUT level, the dominant side, the expected move and its decay into the close. During the session it updates on its own every minute.
Market Maker Levels
The Gaudio Indicator draws the day's market maker support and resistance and the previous session's reference price on a real-time chart of the ES and NQ futures, with volume and the proprietary Summa panel on the state of volatility.
Implied Volatility
Follow implied volatility as it moves: skew, term structure and ATM Vola across 0DTE, weekly and monthly expirations.
Options Chain
Browse the full options chain on stocks, ETFs and futures like ES and NQ: bid/ask premiums, Greeks and implied volatility for every strike and expiry. All you need is a free account: no paid plan, no credit card.
Strategy Builder
Build multi-leg strategies and calculate profit and loss at any price and any date, not just at expiry — with Greeks and breakeven, before you risk capital.
Market Movers
Six rankings over the thousand most traded names on NASDAQ, NYSE and AMEX, stocks and ETFs on separate tabs, with volume measured against what is normal for that time of day and movement measured against each name’s own habits. Every ticker opens the symbol with the full options analysis.
Technical Analysis
A full-height interactive chart on the symbol you are analysing, with volume, MA 200 and SuperTrend already on it, the complete indicator library, drawing tools and every timeframe. Included in every plan, the free one too.
Try Open Interest analysis free for 7 days
Create your account and discover where the market is positioned; the Premium or Ultra plan also unlocks intraday analysis. Cancel anytime during the trial.
Start your free trialStart analyzing options like a professional
Implied volatility, GEX, open interest and volume, proprietary indicators, AI Scanner and a multi-leg strategy builder: every options trading analysis tool in one platform.
Free plan, no credit card · 7-day trial on monthly plans · Cancel anytime
Questions?