Market Maker Levels on ES and NQ, on the Chart Every Day
The Gaudio Indicator draws the day's market maker support and resistance and the previous session's reference price on a real-time chart of the ES and NQ futures, with volume and the proprietary Summa panel on the state of volatility.
What market maker levels are
Market makers are the participants who provide liquidity: they buy when others sell and the other way round, and to do it they have to keep hedging the risk they take on. That hedging does not weigh the same at every price: there are zones where it matters more, and that is where price often slows down, reacts or accelerates.
Market maker levels are those reference zones: a support below the price and a resistance above it, as the starting point for reading the day. They are not lines the price has to respect, but areas where you watch how it reacts: a clean break with volume says something very different from a simple touch.
On the S&P 500 (ES) and Nasdaq 100 (NQ) futures, among the most traded contracts for anyone working on US indices, having these levels ready at the start of the session saves rebuilding them by hand every morning.
How the Gaudio Indicator works
Every day the Gaudio Indicator automatically computes three levels and draws them on the chart: the previous session's reference price line, the market maker resistance and the market maker support. The tabs at the top select the instrument, ES or NQ, and switching tab updates the chart, the levels and the indicator.
The chart is real-time, as a line or as candles, with a timeframe that adapts on its own to your screen and zoom, from 1 to 10 minutes per candle. Below the price a histogram shows the volume of each candle. With Breakout Alerts on you are notified when price breaks the resistance or the support, without having to watch the chart all the time.
At the bottom of the page sits Summa, the proprietary indicator that describes the state of market volatility. The base rule is that the market normally rises with volatility falling and falls with volatility rising: when that relationship breaks, for example the market falls but Summa does not rise as it should, you have a divergence, often an early cue of a change in price behaviour. The arrows next to the date take you back to any previous session.
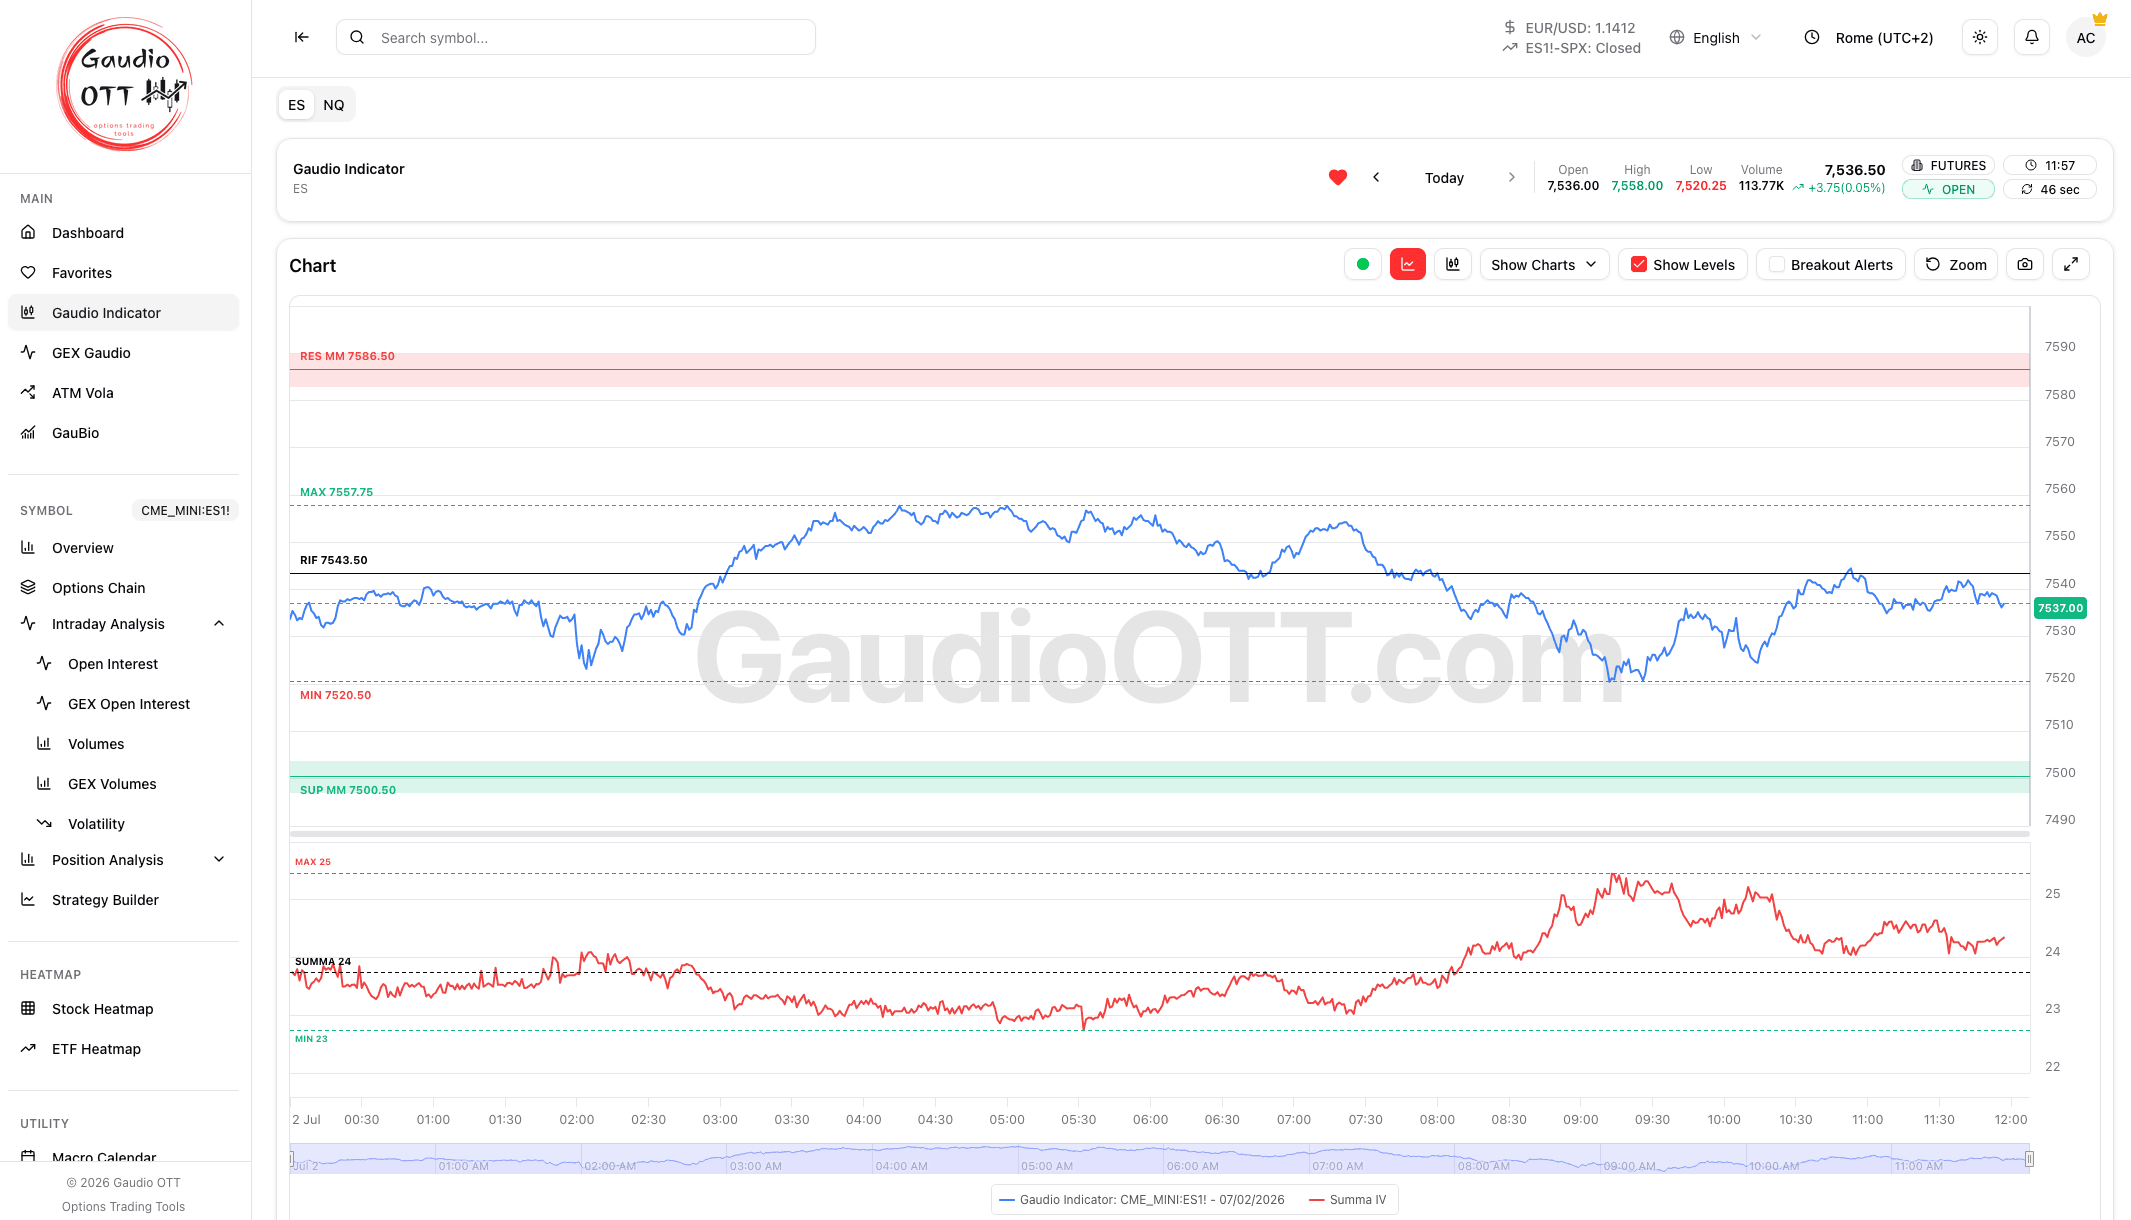
The Gaudio Indicator: the futures chart with the day's market maker levels
How Gaudio OTT helps
Levels ready at the open
Support, resistance and the previous session's reference are computed automatically every day: open the page and you immediately see where the price sits against the day's levels.
ES and NQ on the same page
Two tabs for the two benchmark futures of the US indices: switch from the S&P 500 to the Nasdaq 100 in one click, with levels and indicator updated to the chosen symbol.
Breakout alerts
Breakout Alerts notify you when price breaks the market maker resistance or support (ResMM Breakout and SupMM Breakout): no need to sit in front of the chart all day.
Summa for volatility context
The proprietary panel tells you whether volatility is confirming the price move or contradicting it: the same break of a level reads differently in the two cases.
How to use it in your trading
Prepare the day
At the start of the session note where support and resistance sit against the opening price, then leave the alerts on for the rest of the day.
Read a breakout
A break of the resistance with Summa falling describes a move confirmed by volatility; the same break with Summa rising comes with growing uncertainty, and calls for more caution.
Spot a divergence
Price still making new extremes while Summa stops confirming is the situation the panel exists to surface: with Price, Volume and Summa all visible you compare the same moment across the three panels.
Review past sessions
The arrows next to the date take you back to any previous session, to study how price reacted to the levels on days that have already closed. In historical mode the alerts switch off, since there is nothing live to alert on.
What makes the Gaudio Indicator different
Support and resistance can be drawn by hand, and every trader has a method. The Gaudio Indicator starts from a different idea: levels computed automatically every day, always with the same method, and already on the chart at the open, so the time goes into reading how price reacts instead of redrawing lines.
And the levels are not an isolated list of numbers: they sit on the same chart as volume and Summa, because a level on its own does not tell you whether the market is breaking it with conviction. They remain reference areas, not buy or sell signals. For gamma exposure on SPX, GEX Gaudio sits in the same platform.
Frequently asked questions about market maker levels
Learn more in the documentation
Read the guideRelated topics
AI Options Scanner
Two intelligent scanners — AI Suggestions on the symbol you're analyzing and the Opportunities Scanner on the entire US market — analyze thousands of contracts in real time across stocks, ETFs and futures, and show you only the trades with the best risk/reward profile.
GEX / Gamma Exposure
Two GEX tools — on open interest and on volume — for SPX, NDX, ETFs and stocks with options, plus the proprietary GEX Gaudio for intraday trading.
0DTE SPX
Dance Gaudio shows the volume of SPX options expiring today traded in the last minutes, strike by strike: the CALL level and the PUT level, the dominant side, the expected move and its decay into the close. During the session it updates on its own every minute.
Open Interest
See where positioning concentrates at every strike and expiry, to understand the levels the market defends.
Implied Volatility
Follow implied volatility as it moves: skew, term structure and ATM Vola across 0DTE, weekly and monthly expirations.
Options Chain
Browse the full options chain on stocks, ETFs and futures like ES and NQ: bid/ask premiums, Greeks and implied volatility for every strike and expiry. All you need is a free account: no paid plan, no credit card.
Strategy Builder
Build multi-leg strategies and calculate profit and loss at any price and any date, not just at expiry — with Greeks and breakeven, before you risk capital.
Market Movers
Six rankings over the thousand most traded names on NASDAQ, NYSE and AMEX, stocks and ETFs on separate tabs, with volume measured against what is normal for that time of day and movement measured against each name’s own habits. Every ticker opens the symbol with the full options analysis.
Technical Analysis
A full-height interactive chart on the symbol you are analysing, with volume, MA 200 and SuperTrend already on it, the complete indicator library, drawing tools and every timeframe. Included in every plan, the free one too.
Open today's levels on ES and NQ
Start the 7-day free trial and open the Gaudio Indicator: market maker support and resistance, volume and Summa on a real-time chart of ES and NQ.
Try it free for 7 daysStart analyzing options like a professional
Implied volatility, GEX, open interest and volume, proprietary indicators, AI Scanner and a multi-leg strategy builder: every options trading analysis tool in one platform.
Free plan, no credit card · 7-day trial on monthly plans · Cancel anytime
Questions?