Technical Analysis: the price chart next to your options analysis
A full-height interactive chart on the symbol you are analysing, with volume, MA 200 and SuperTrend already on it, the complete indicator library, drawing tools and every timeframe. Included in every plan, the free one too.
What technical analysis is
Technical analysis studies the price and volume of an instrument to inform trading decisions: where price found demand and supply in the past, which way it is heading, how large the move has been compared with that name’s own habits. It does not predict the future, but it supplies the references — support, resistance, trend, volatility — a trade is built on.
For anyone working in options the chart is not an alternative to the Greeks: it is the step that comes first. A strike is chosen against a level, an expiration against a horizon, a strategy against a direction or the absence of one. Without a reference on price, delta and implied volatility stay numbers without context.
On Gaudio OTT, Technical Analysis is the chart page inside the Symbol section, next to the options chain, open interest, intraday volumes and GEX of the same instrument.
How the chart works
The chart opens on the daily timeframe, as candles, with three things already loaded: volume as bars under the price, the 200-period simple moving average, and SuperTrend, the band that colours the background by trend. They are the three references you almost always want, so the page is useful from the first second with nothing to configure.
From there you have every tool: quick timeframes from one minute to daily with every other interval in the menu, the chart types (candles, bars, line, area), the full indicator library to add to the three preloaded ones, and the vertical drawing bar with trend lines, horizontal levels, Fibonacci, channels, text and a measuring tool. The camera icon saves the chart as an image.
The chart follows your app settings: language, time zone and light or dark theme all come from your account. The symbol comes from the app too, which is why it cannot be changed from inside the chart: it always shows the active symbol, so it cannot drift away from the rest of the analysis you are looking at on the same instrument.
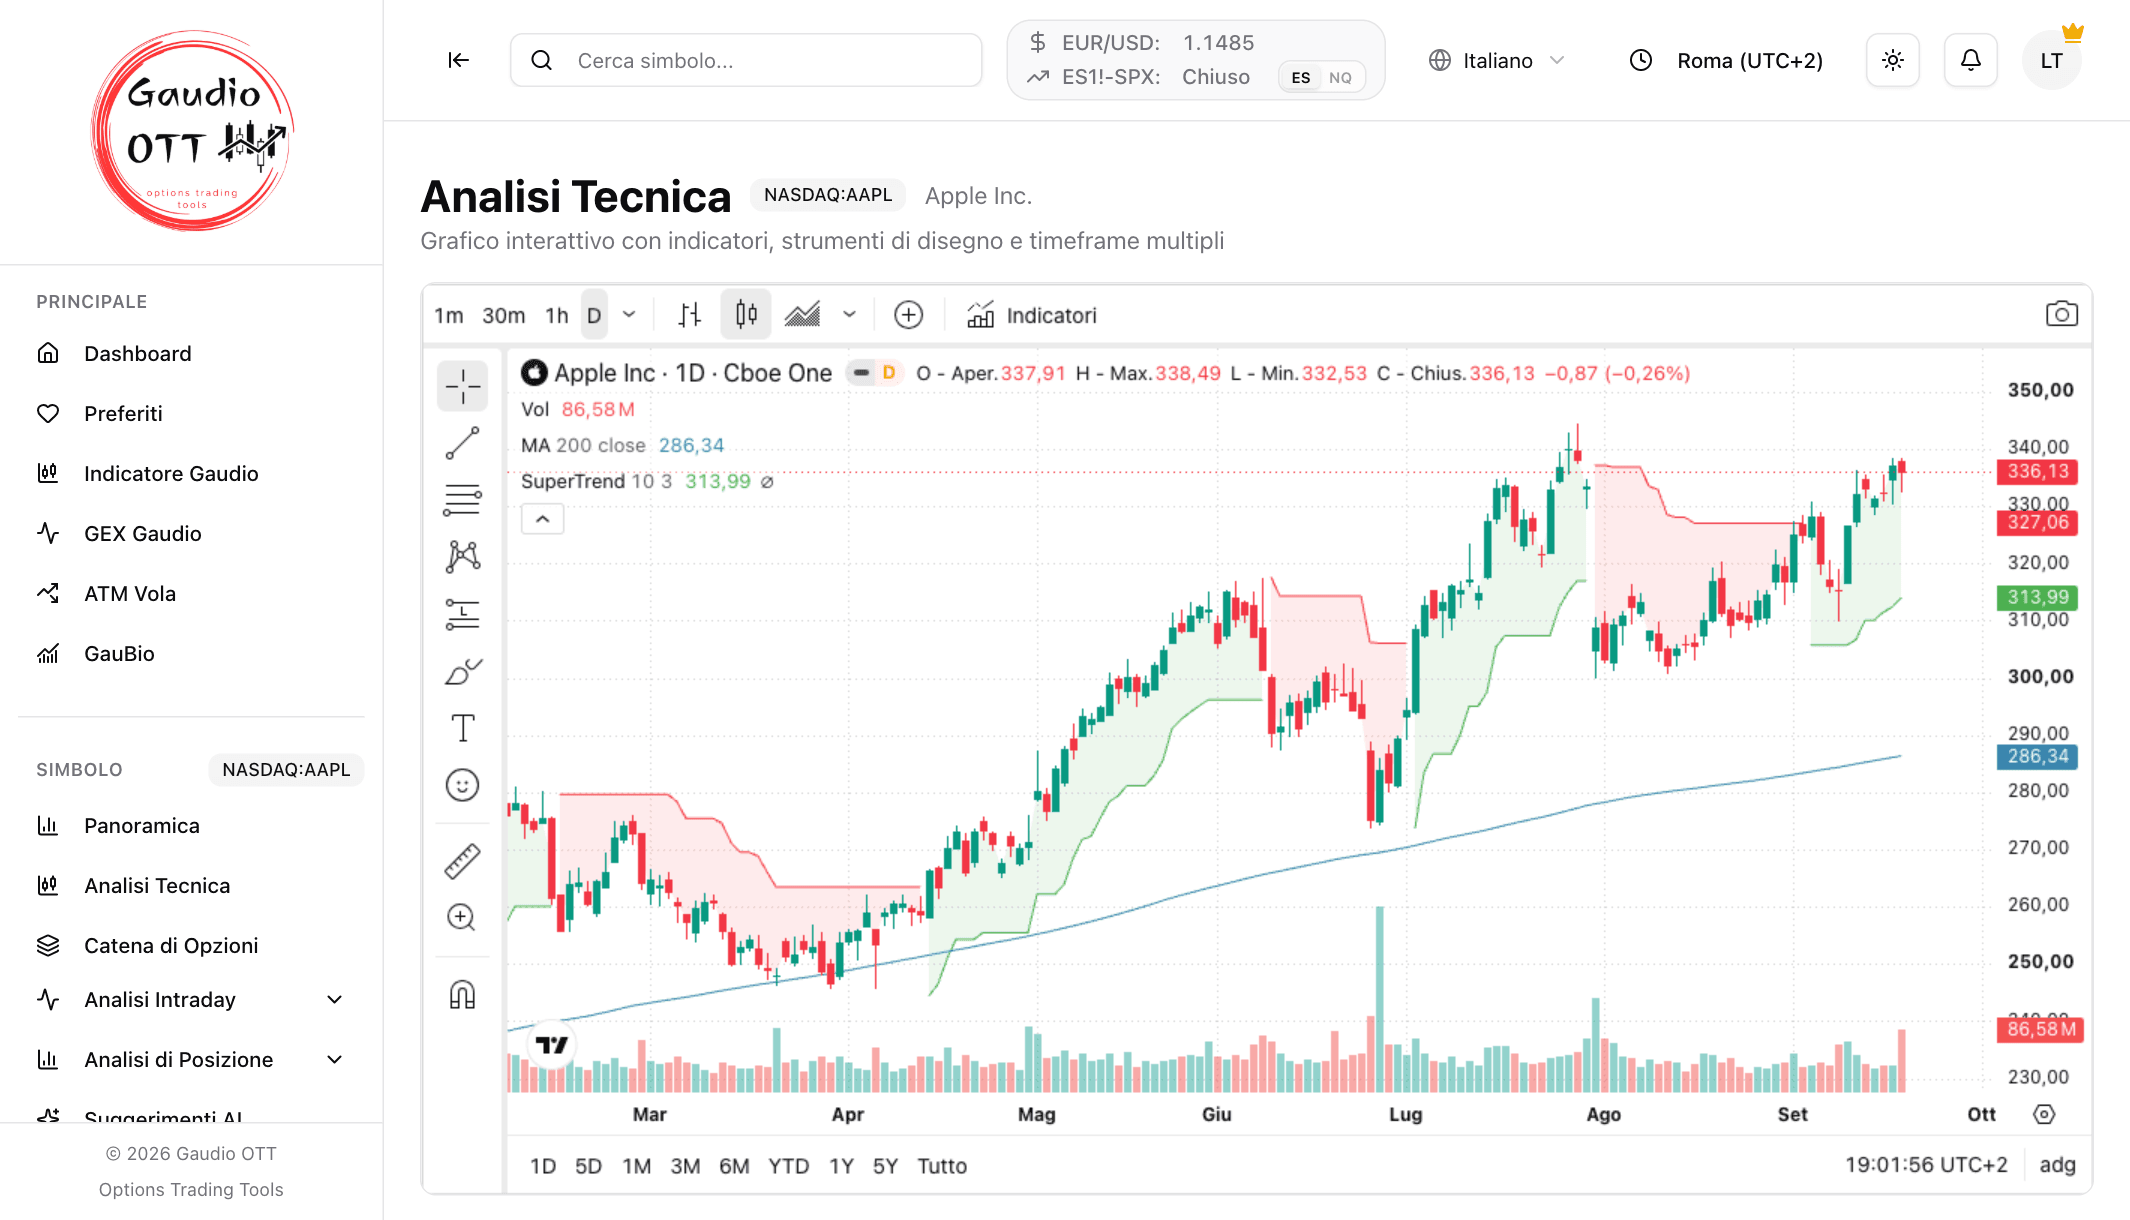
The full-height chart with volume, MA 200 and SuperTrend already loaded, the timeframe bar on top and the drawing tools on the left
How Gaudio OTT helps
Included in every plan
Technical Analysis is available on all plans, the free one included: all it takes is an account with a verified email.
Ready to use
Volume, MA 200 and SuperTrend are already on the chart when it opens: you do not have to rebuild your setup every time you switch instrument.
Always the same symbol as the rest
The chart shows the platform’s active symbol, so you move between chain, GEX, volumes and price with no risk of looking at two different instruments believing they are one.
Every timeframe and the drawing tools
From one minute to daily and beyond, with trend lines, levels, Fibonacci, channels and a measuring tool, plus the complete indicator library.
How to use it alongside options
Pick a strike against a level
Find support and resistance on the chart, then open the chain and look for the strike on the right side of that level: it is the most direct way to turn a technical reading into a contract.
Decide whether to sell premium
A range-bound market on the chart and a high implied volatility on the chain are the combination that makes selling premium sensible; a strong trend is the reason not to.
Measure the expected move
The measuring tool tells you how far price travelled in a given stretch of time in the past: an immediate comparison with the move implied volatility is pricing to expiration.
Compare price with positioning
The technical levels on the chart and those that emerge from open interest and GEX tell two different stories about the same instrument: when they agree, the level is worth more.
What makes Gaudio OTT’s Technical Analysis different
It is not a charting platform trying to compete with the dedicated ones: it is the chart that was missing next to the options analysis. The value is that it lives in the same workspace as the chain, open interest, intraday volumes, GEX, implied volatility and the strategy builder, always on the same active symbol, with no tab switching and no risk of the tools drifting apart.
Two things are worth saying plainly. Indicators and drawings you add stay for as long as the page is open and are not saved, because there is no charting account to create behind it: if you need a drawing, you save it as an image. And for some instruments — CME futures, US cash indices and cash VIX — the chart shows the closest free equivalent, and says so with a badge on the page instead of leaving the symbol without a chart.
Frequently asked questions about Technical Analysis
Learn more in the documentation
Read the guideRelated topics
AI Options Scanner
Two intelligent scanners — AI Suggestions on the symbol you're analyzing and the Opportunities Scanner on the entire US market — analyze thousands of contracts in real time across stocks, ETFs and futures, and show you only the trades with the best risk/reward profile.
GEX / Gamma Exposure
Two GEX tools — on open interest and on volume — for SPX, NDX, ETFs and stocks with options, plus the proprietary GEX Gaudio for intraday trading.
Open Interest
See where positioning concentrates at every strike and expiry, to understand the levels the market defends.
Implied Volatility
Follow implied volatility as it moves: skew, term structure and ATM Vola across 0DTE, weekly and monthly expirations.
Options Chain
Browse the full options chain on stocks, ETFs and futures like ES and NQ: bid/ask premiums, Greeks and implied volatility for every strike and expiry. All you need is a free account: no paid plan, no credit card.
Strategy Builder
Build multi-leg strategies and calculate profit and loss at any price and any date, not just at expiry — with Greeks and breakeven, before you risk capital.
Market Movers
Six rankings over the thousand most traded names on NASDAQ, NYSE and AMEX, stocks and ETFs on separate tabs, with volume measured against what is normal for that time of day and movement measured against each name’s own habits. Every ticker opens the symbol with the full options analysis.
Open the chart: it is included in the free plan
Create your free account and open Technical Analysis on the symbol you care about, with volume, MA 200 and SuperTrend already loaded and the options chain one click away.
Try it freeStart analyzing options like a professional
Implied volatility, GEX, open interest and volume, multi-leg strategy builder: every options trading analysis tool in one platform.
No credit card · Free plan forever · Cancel anytime
Questions?