Market Movers: what is moving in the US market right now
Six rankings over the thousand most traded names on NASDAQ, NYSE and AMEX, stocks and ETFs on separate tabs, with volume measured against what is normal for that time of day and movement measured against each name’s own habits. Every ticker opens the symbol with the full options analysis.
What market movers are
Market movers are the names that stand out from the rest of the board in a session: for how far they move, for how much they trade, or for how far they opened from the previous close. They are the starting point for anyone looking for the trade of the day, because unusual activity is almost always the trace of a news item, an earnings report or an institutional flow.
The trouble with traditional rankings is that they sort by raw percentage change, and that selects by size rather than by anomaly: minus seventeen per cent is an event on a mega cap and an ordinary day on a volatile small cap. In the same way, absolute volume always rewards the same names, and the ratio to the ten-day average understates every name mid-morning, because it compares half a session with whole ones.
Market Movers fixes both distortions: volume is compared with the same hours of previous sessions, and movement is divided by how much that name usually swings. A name worth eight billion and one worth eight hundred million can then be read with the same yardstick.
How the page works
Every session the page ranks the thousand most traded names on NASDAQ, NYSE and AMEX. The universe is not a fixed list: it is made of the names something is actually happening to today. Stocks and ETFs sit on two separate tabs with their own columns, because a fund is judged on AUM, NAV premium or discount and expenses, not on a company’s metrics.
Six rankings open the page: highest volume, unusual volume, gainers, losers, gaps and weekly volatility. Below them, a strip holds the shortest and most useful list of all: the names that combine trading far above normal with a move that is outsized for their own habits. If there is nothing to flag on a given day the strip does not appear at all, because on a quiet market “no anomaly” is the correct answer.
The sortable table under the rankings carries price, change, volume, relative volume, gap, pre-market, market cap, days to the next earnings date and sector, with four universe presets that clear out the microcaps where a four-figure multiplier means nothing. Outside cash hours, the top of the page carries the pre-market or after-hours panel.
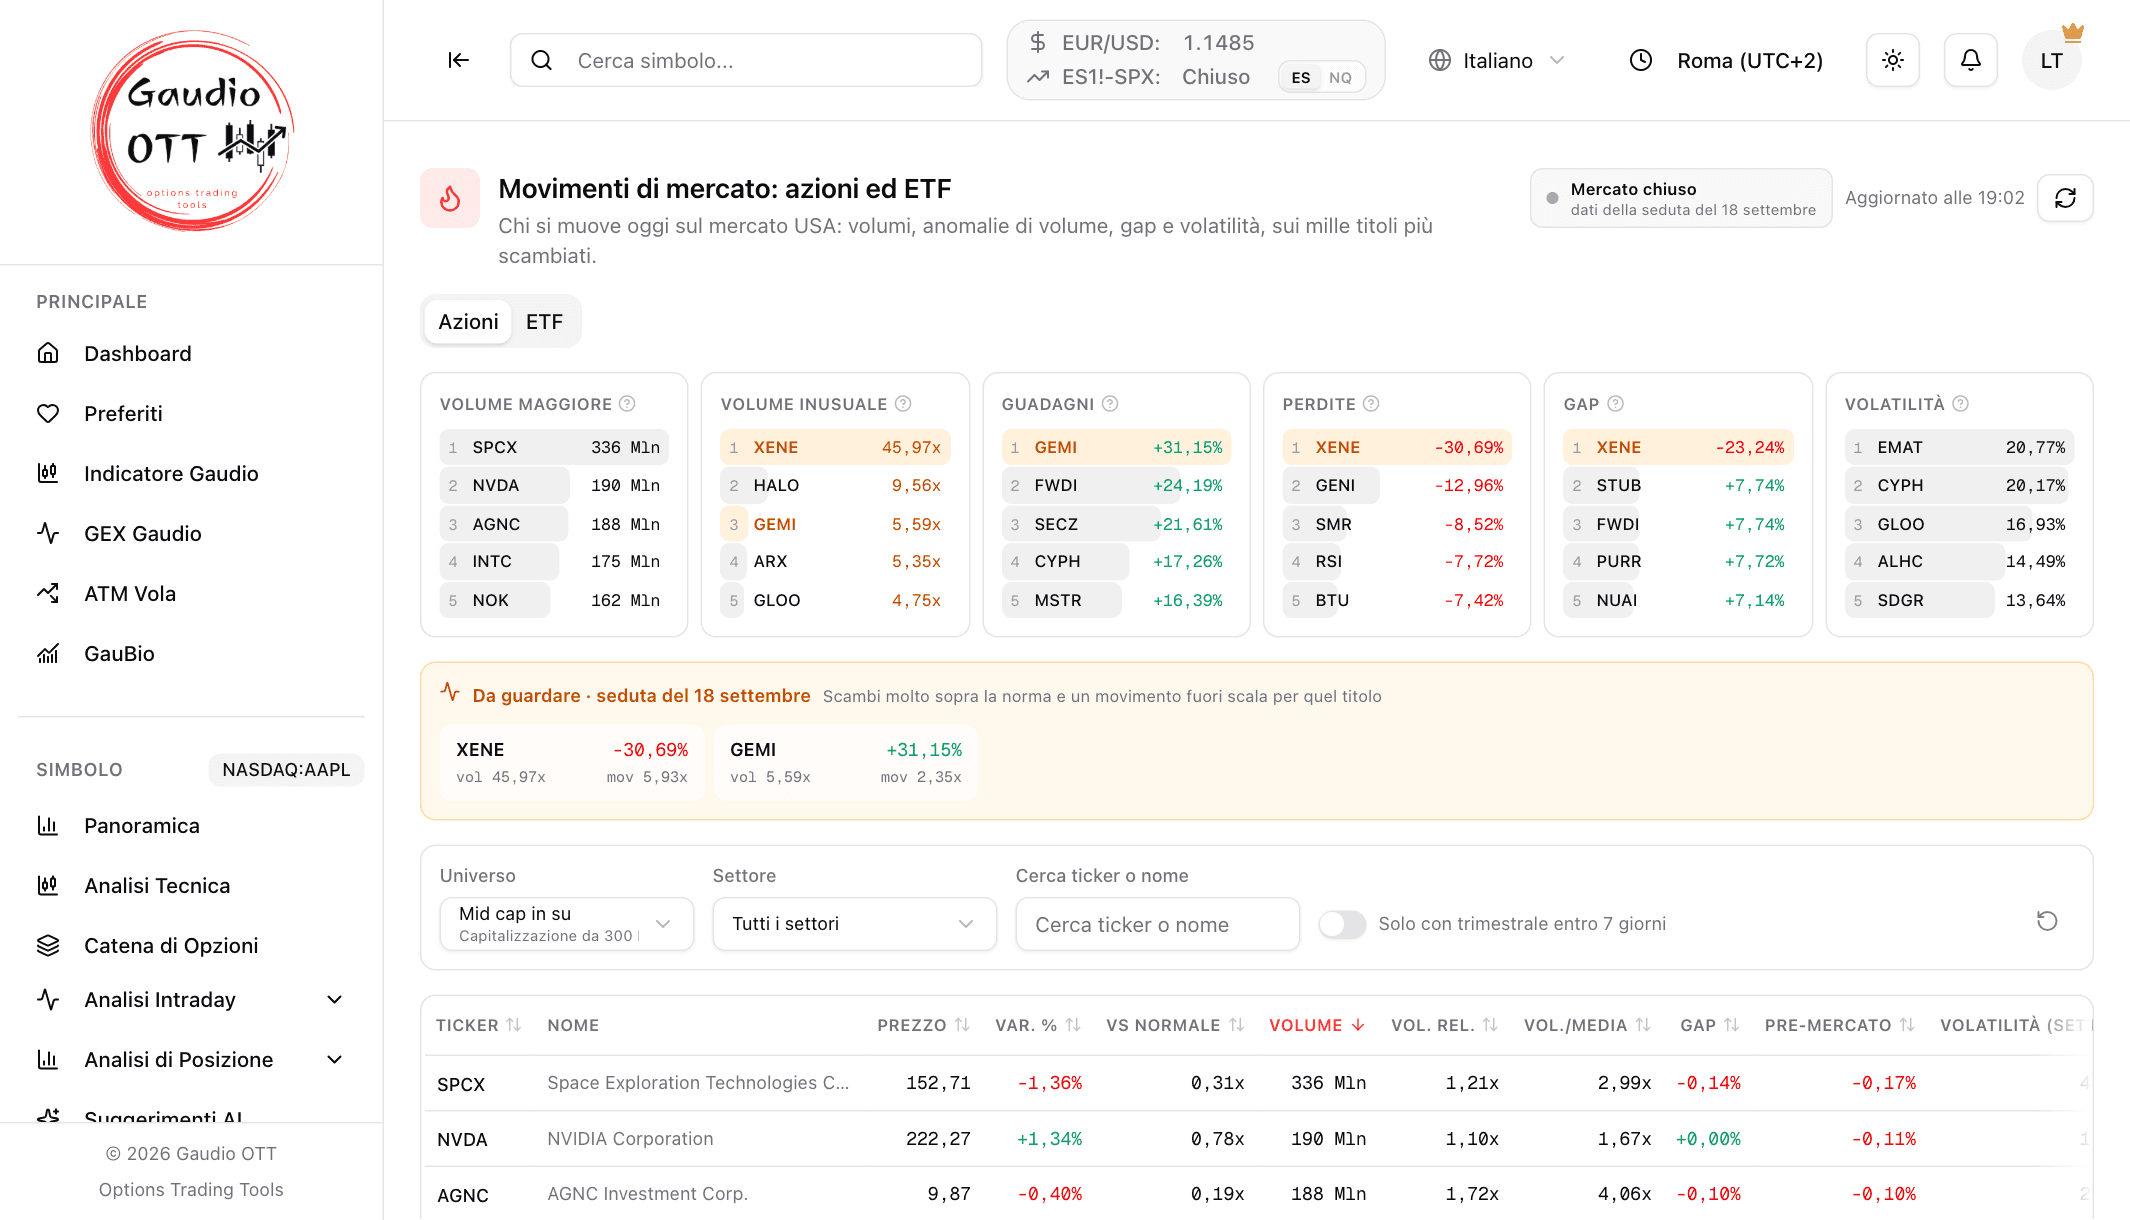
The six rankings of the session, the strip of names trading and moving far above their own normal, and the sortable table of the thousand most traded names
How Gaudio OTT helps
Volume relative to the time of day
Volume right now compared with the same moment in previous sessions: it makes sense ten minutes after the open, when the ratio to the ten-day average is still unusable.
Moves you can compare across names
The Vs normal column divides today’s move by how much that name usually swings, so you read “how many normal days happened today” — a number that means the same on a mega cap and on a small cap.
A strip that stays quiet when there is nothing
The list of genuinely unusual names appears only when there are some: an alert that is always on only teaches you to ignore it.
One click to the options
Every ticker opens the symbol and makes it active across the platform: chain, open interest, volumes, GEX and strategy builder on the same name, without starting the search again.
How to use it in your trading
Find the reaction to a news item
Trading far above normal together with an outsized move is the signature of a reaction: it is the list to start from when you are looking for what happened this morning.
Prepare for earnings
The filter for names reporting within seven days isolates the event rather than the move, which is what you want when the strategy starts from the date and not from the price.
Look for underlyings with liquid options
Volume and market cap narrow the page down to the names worth opening a chain on: where trading is heavy, options bid-ask spreads are almost always tighter.
See where the activity is
The sector breakdown says how much of the day’s volume sits in each sector and how many names produce it: a share made of ten names is a very different market from the same share spread over a hundred.
What makes this page different
The movers lists you find elsewhere sort by percentage change and by absolute volume: two criteria that reward small names and large names respectively, and that therefore show almost always the same tickers. Here both measures are normalised — volume against the time of day, movement against each name’s own habits — and that changes who ends up at the top.
And it is not a dead end. On a quotes site the ranking stops there: you have a ticker and you have to start again somewhere else. Here the ticker opens the symbol inside the platform, with the options chain, open interest, intraday volumes, GEX and the strategy builder already pointed at that name.
Frequently asked questions about market movers
Learn more in the documentation
Read the guideRelated topics
AI Options Scanner
Two intelligent scanners — AI Suggestions on the symbol you're analyzing and the Opportunities Scanner on the entire US market — analyze thousands of contracts in real time across stocks, ETFs and futures, and show you only the trades with the best risk/reward profile.
GEX / Gamma Exposure
Two GEX tools — on open interest and on volume — for SPX, NDX, ETFs and stocks with options, plus the proprietary GEX Gaudio for intraday trading.
Open Interest
See where positioning concentrates at every strike and expiry, to understand the levels the market defends.
Implied Volatility
Follow implied volatility as it moves: skew, term structure and ATM Vola across 0DTE, weekly and monthly expirations.
Options Chain
Browse the full options chain on stocks, ETFs and futures like ES and NQ: bid/ask premiums, Greeks and implied volatility for every strike and expiry. All you need is a free account: no paid plan, no credit card.
Strategy Builder
Build multi-leg strategies and calculate profit and loss at any price and any date, not just at expiry — with Greeks and breakeven, before you risk capital.
Technical Analysis
A full-height interactive chart on the symbol you are analysing, with volume, MA 200 and SuperTrend already on it, the complete indicator library, drawing tools and every timeframe. Included in every plan, the free one too.
See what is moving today
Start the 7-day free trial and open Market Movers: rankings, relative volume and a sortable table across the whole US market, with every ticker one click from the options analysis.
Try it free for 7 daysStart analyzing options like a professional
Implied volatility, GEX, open interest and volume, multi-leg strategy builder: every options trading analysis tool in one platform.
No credit card · Free plan forever · Cancel anytime
Questions?