SPX 0DTE Options: Where the Market Is Trading Right Now
Dance Gaudio shows the volume of SPX options expiring today traded in the last minutes, strike by strike: the CALL level and the PUT level, the dominant side, the expected move and its decay into the close. During the session it updates on its own every minute.
What SPX 0DTE options are
0DTE options (zero days to expiration) are contracts that expire in the same session they are traded. SPX, the S&P 500 index, has an expiration on every trading day, Monday to Friday: whoever trades them holds an instrument that lives a few hours, with theta eating the premium minute after minute and very high gamma on the strikes near the price.
Precisely because they live so briefly, 0DTE options have become a significant part of SPX options trading, and their flow says a lot about where activity is concentrating during the day. The figure you usually find, though, is the total volume since the open: by mid-afternoon it adds up what happened in the morning, when the price was somewhere else, with what is happening now.
Dance Gaudio looks at the volume of the last minutes instead. As the session goes on the expected move shrinks, and recent volume tells you where the market is working far better than the volume piled up since the morning.
In practice it is for choosing the strikes of 0DTE vertical spreads. Your view decides the direction and the type of spread, credit or debit; the CALL and PUT levels, best inside the expected move and read together with GEX Gaudio, are the reference for placing the legs.
How Dance Gaudio works
The data of SPX options expiring today is recorded every minute, from a few minutes before the US cash market opens until the close. Pick a window — 5, 15, 30 or 60 minutes with the quick buttons, any value from 5 to 120 minutes from the menu, or the whole session — and the page counts the call and put contracts traded in that window on every strike, every 5 points, within about 3% of the SPX price.
The strike profile shows the call and put bars of the window with three lines: the CALL level, on the strike with the most call volume, the PUT level, on the strike with the most put volume, and the SPX price, surrounded by the expected move band. Next to it, the levels history shows where CALL and PUT were minute by minute through the session, on the same price scale, so a strike sits at the same height in both charts.
Below, the EM and DECAY panel compares the expected move — the move in SPX points that the options are pricing until the close — with the path the expected move of the open would follow if only time passed. On a closed session a slider moves the whole page to any minute of the day, and the last 30 days are kept.
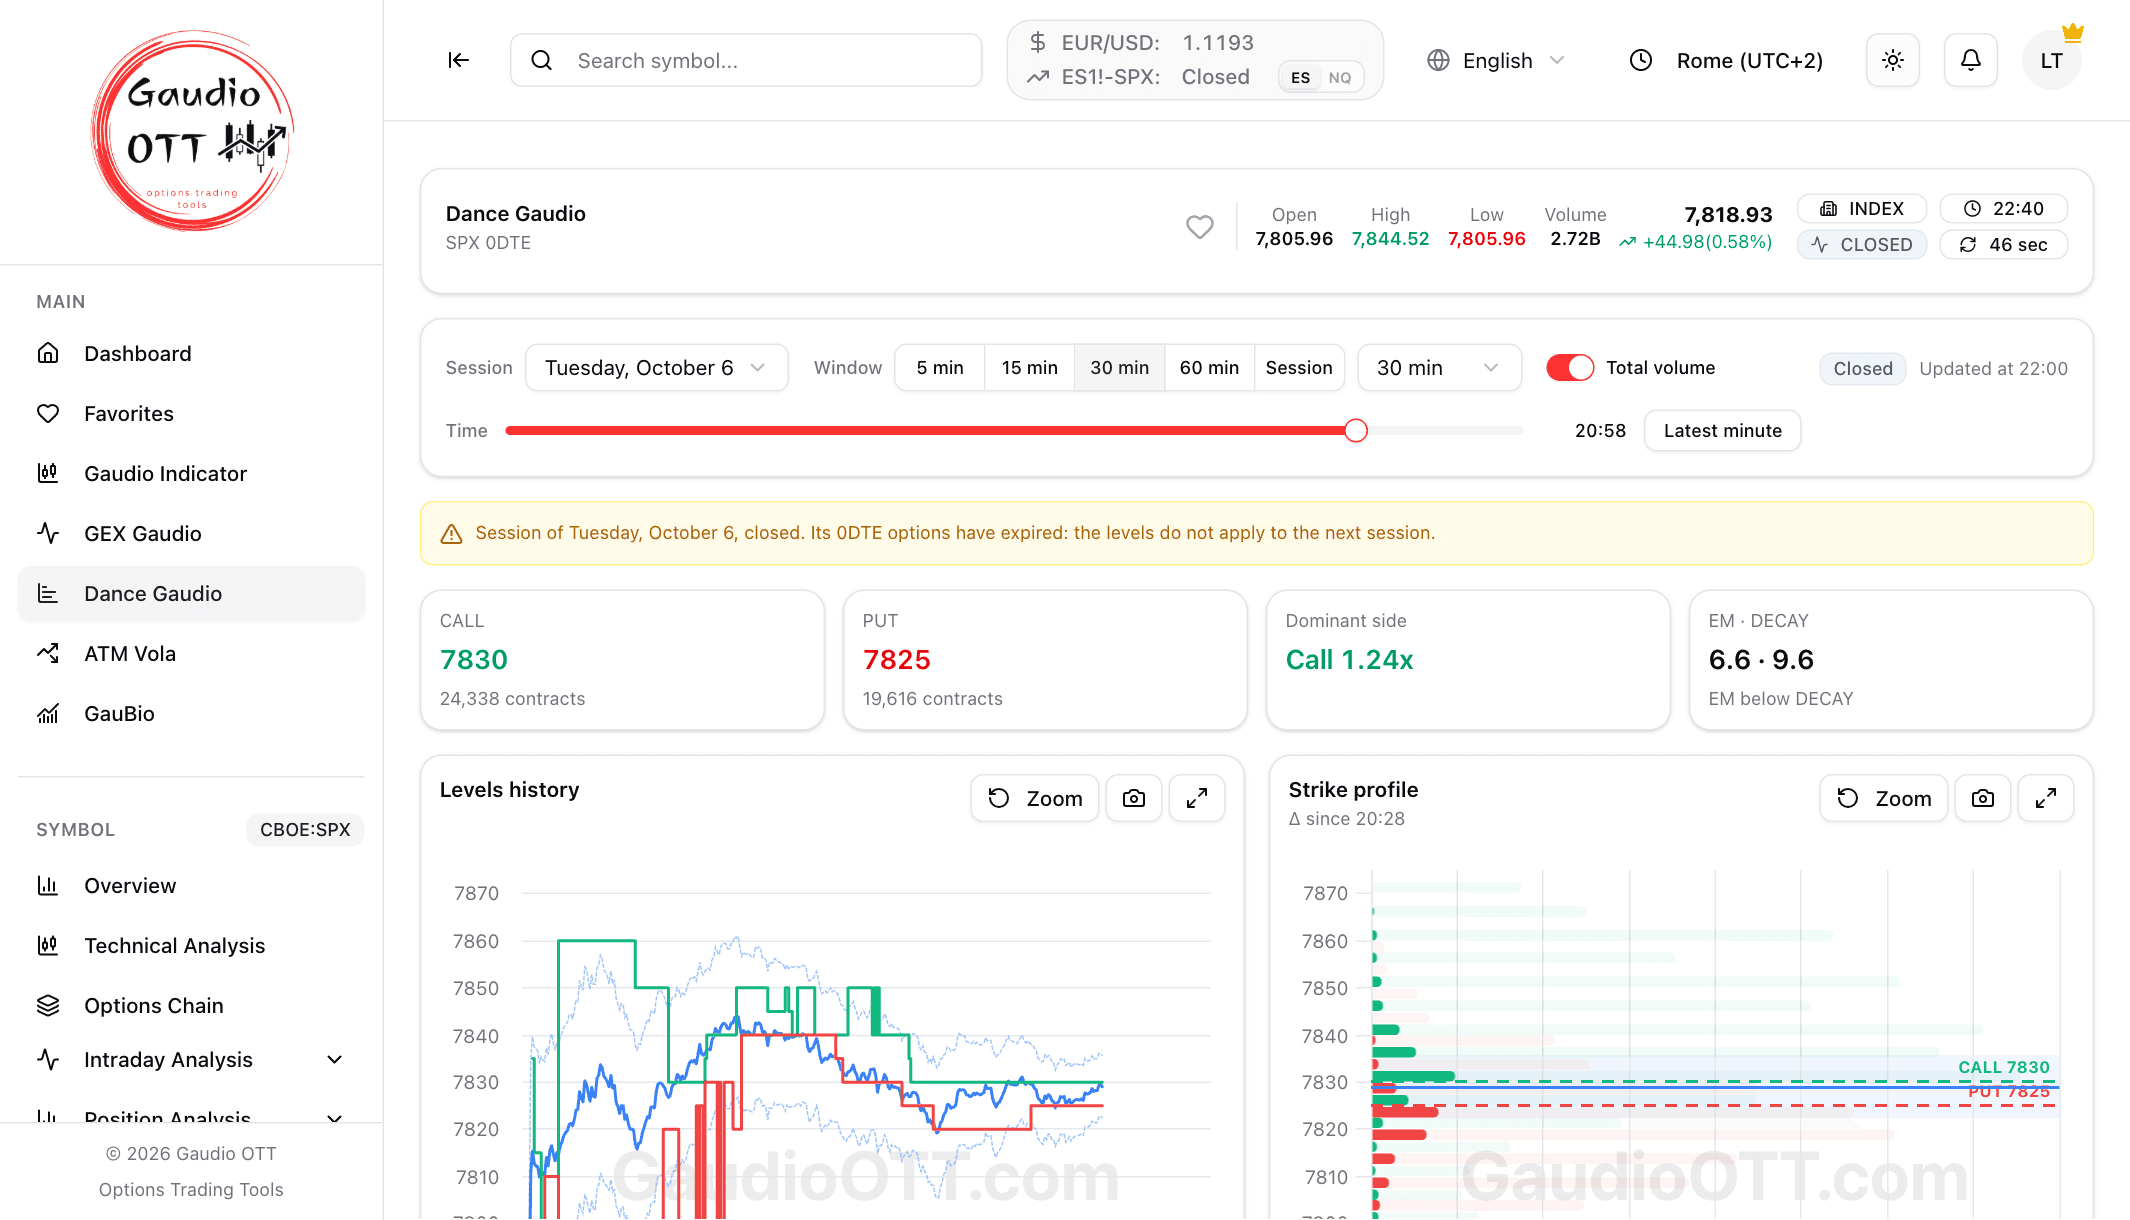
Dance Gaudio: the summary cards with EM and DECAY, the history of the CALL and PUT levels and the strike profile of the chosen window
How Gaudio OTT helps
Volume right now, not the day's total
The moving window shows where 0DTE options are trading in the last minutes. With Total volume on you also see the volume since the open behind it, and can tell whether the activity is still where it was in the morning or has moved.
CALL and PUT levels minute by minute
The levels history shows how long the market kept returning to the same strike: a level that holds for tens of minutes says more than one that appears for a single minute.
Expected move and decay side by side
EM above DECAY means the market is pricing more movement than time alone would explain; EM below DECAY means volatility is compressing faster.
Every session, replayable by the minute
The last 30 days are kept and the time slider takes the page back to any minute of the session: useful to study how a day that has already closed actually unfolded.
How to use it in your trading
Choose the strikes of a vertical spread
Once your view is set, bullish or bearish, credit or debit, the CALL and PUT levels are the reference for placing the legs: the strikes where recent volume concentrates, the ones volume is moving towards.
Size the window to the trade
30 and 60 minutes are the most used windows; a shorter one for a quick trade, a longer one or the whole session for one that has to last.
Prefer levels inside the expected move
The expected move is how far options price SPX could move before the close: levels inside the band are prices the market considers within reach, those outside count less.
Read the levels next to GEX Gaudio
Dance Gaudio is used together with GEX Gaudio: the 0DTE volume levels are read next to the SPX gamma levels.
What makes Dance Gaudio different
The 0DTE data you find most often is either the volume accumulated since the open, which mixes different hours at different prices, or the contract-by-contract flow in a scrolling list, impossible to read at a glance. Dance Gaudio sits in between: it aggregates by strike, but over a window you choose and that moves along with the session.
And it says plainly what it is not. It counts the contracts traded, not whether they were bought or sold, and it is not open interest: a level is where trading is happening, not a guaranteed support or resistance, and it is read together with the price and the expected move. For market-maker gamma exposure on the same index, GEX Gaudio sits in the same platform.
Frequently asked questions about 0DTE options and Dance Gaudio
Learn more in the documentation
Read the guideRelated topics
AI Options Scanner
Two intelligent scanners — AI Suggestions on the symbol you're analyzing and the Opportunities Scanner on the entire US market — analyze thousands of contracts in real time across stocks, ETFs and futures, and show you only the trades with the best risk/reward profile.
GEX / Gamma Exposure
Two GEX tools — on open interest and on volume — for SPX, NDX, ETFs and stocks with options, plus the proprietary GEX Gaudio for intraday trading.
Market Maker Levels
The Gaudio Indicator draws the day's market maker support and resistance and the previous session's reference price on a real-time chart of the ES and NQ futures, with volume and the proprietary Summa panel on the state of volatility.
Open Interest
See where positioning concentrates at every strike and expiry, to understand the levels the market defends.
Implied Volatility
Follow implied volatility as it moves: skew, term structure and ATM Vola across 0DTE, weekly and monthly expirations.
Options Chain
Browse the full options chain on stocks, ETFs and futures like ES and NQ: bid/ask premiums, Greeks and implied volatility for every strike and expiry. All you need is a free account: no paid plan, no credit card.
Strategy Builder
Build multi-leg strategies and calculate profit and loss at any price and any date, not just at expiry — with Greeks and breakeven, before you risk capital.
Market Movers
Six rankings over the thousand most traded names on NASDAQ, NYSE and AMEX, stocks and ETFs on separate tabs, with volume measured against what is normal for that time of day and movement measured against each name’s own habits. Every ticker opens the symbol with the full options analysis.
Technical Analysis
A full-height interactive chart on the symbol you are analysing, with volume, MA 200 and SuperTrend already on it, the complete indicator library, drawing tools and every timeframe. Included in every plan, the free one too.
See where SPX 0DTE options are trading today
Start the 7-day free trial on the monthly Ultra plan and open Dance Gaudio: volume by strike, CALL and PUT levels and expected move, updated every minute.
Try it free for 7 daysStart analyzing options like a professional
Implied volatility, GEX, open interest and volume, proprietary indicators, AI Scanner and a multi-leg strategy builder: every options trading analysis tool in one platform.
Free plan, no credit card · 7-day trial on monthly plans · Cancel anytime
Questions?