Market maker GEX on SPX 0DTE, from today's trades
Vecta Gaudio calculates, strike by strike, whether market makers are long or short gamma on SPX options expiring today, from who bought and who sold during the session. Green where their hedging slows price down, red where it speeds it up. It updates every minute during the session.
What market maker GEX is
A market maker who sells an option does not want to bet on direction: they hedge by buying or selling the underlying, usually futures. How much they have to rebalance that hedge when price moves depends on the gamma of the options in their book, and GEX (Gamma Exposure) puts it in dollars: how much the hedge changes for a 1% move.
The sign is what matters. If the market maker is long gamma on a strike, staying hedged means selling when price rises and buying when it falls: they trade against the move and slow it down. If they are short gamma they do the opposite, buying rises and selling falls: they trade with the move and speed it up. On 0DTE options, which expire the same day, gamma near price is very high, and these hedging flows weigh on price more than on any other expiration.
The problem is that the market makers' book is not public. Classic GEX rebuilds it with a fixed assumption: customers buy calls and sell puts, so market makers are short calls and long puts. It is a reasonable assumption on average, but on a single session and a single strike it can be wrong: covered call sellers, protective put buyers, spreads opened and closed in the same morning all move the picture one way or the other.
How Vecta Gaudio works
Vecta Gaudio drops the fixed assumption. It follows the session's trades on SPX options expiring today and calculates, strike by strike, which side market makers ended up on: the sign of the bar comes from there, not from the option type. That is why a put can be a green bar and a call a red one, and why the picture starts from zero at every open.
The chart shows one bar per strike, every 5 points around price: green to the right of zero where market makers are long gamma, red to the left where they are short. The length is the strike's GEX, and hovering it shows the net position in contracts, how many ES futures the hedge moves per SPX point and how far the strike is from price. On the left runs the SPX price of the session, on the same scale, with the expected move band to the close.
At the top right a line sums up the three levels to watch: the brake above and the brake below, the largest green bars above and below price, and the unstable strike, the largest red bar. The dots on the bars show where each bar stood 1, 5, 10, 15 and 30 minutes earlier, and bars that are not clear-cut yet are drawn faded instead of disappearing. One click moves everything onto the ES future, and with the market closed a slider replays the last session minute by minute.
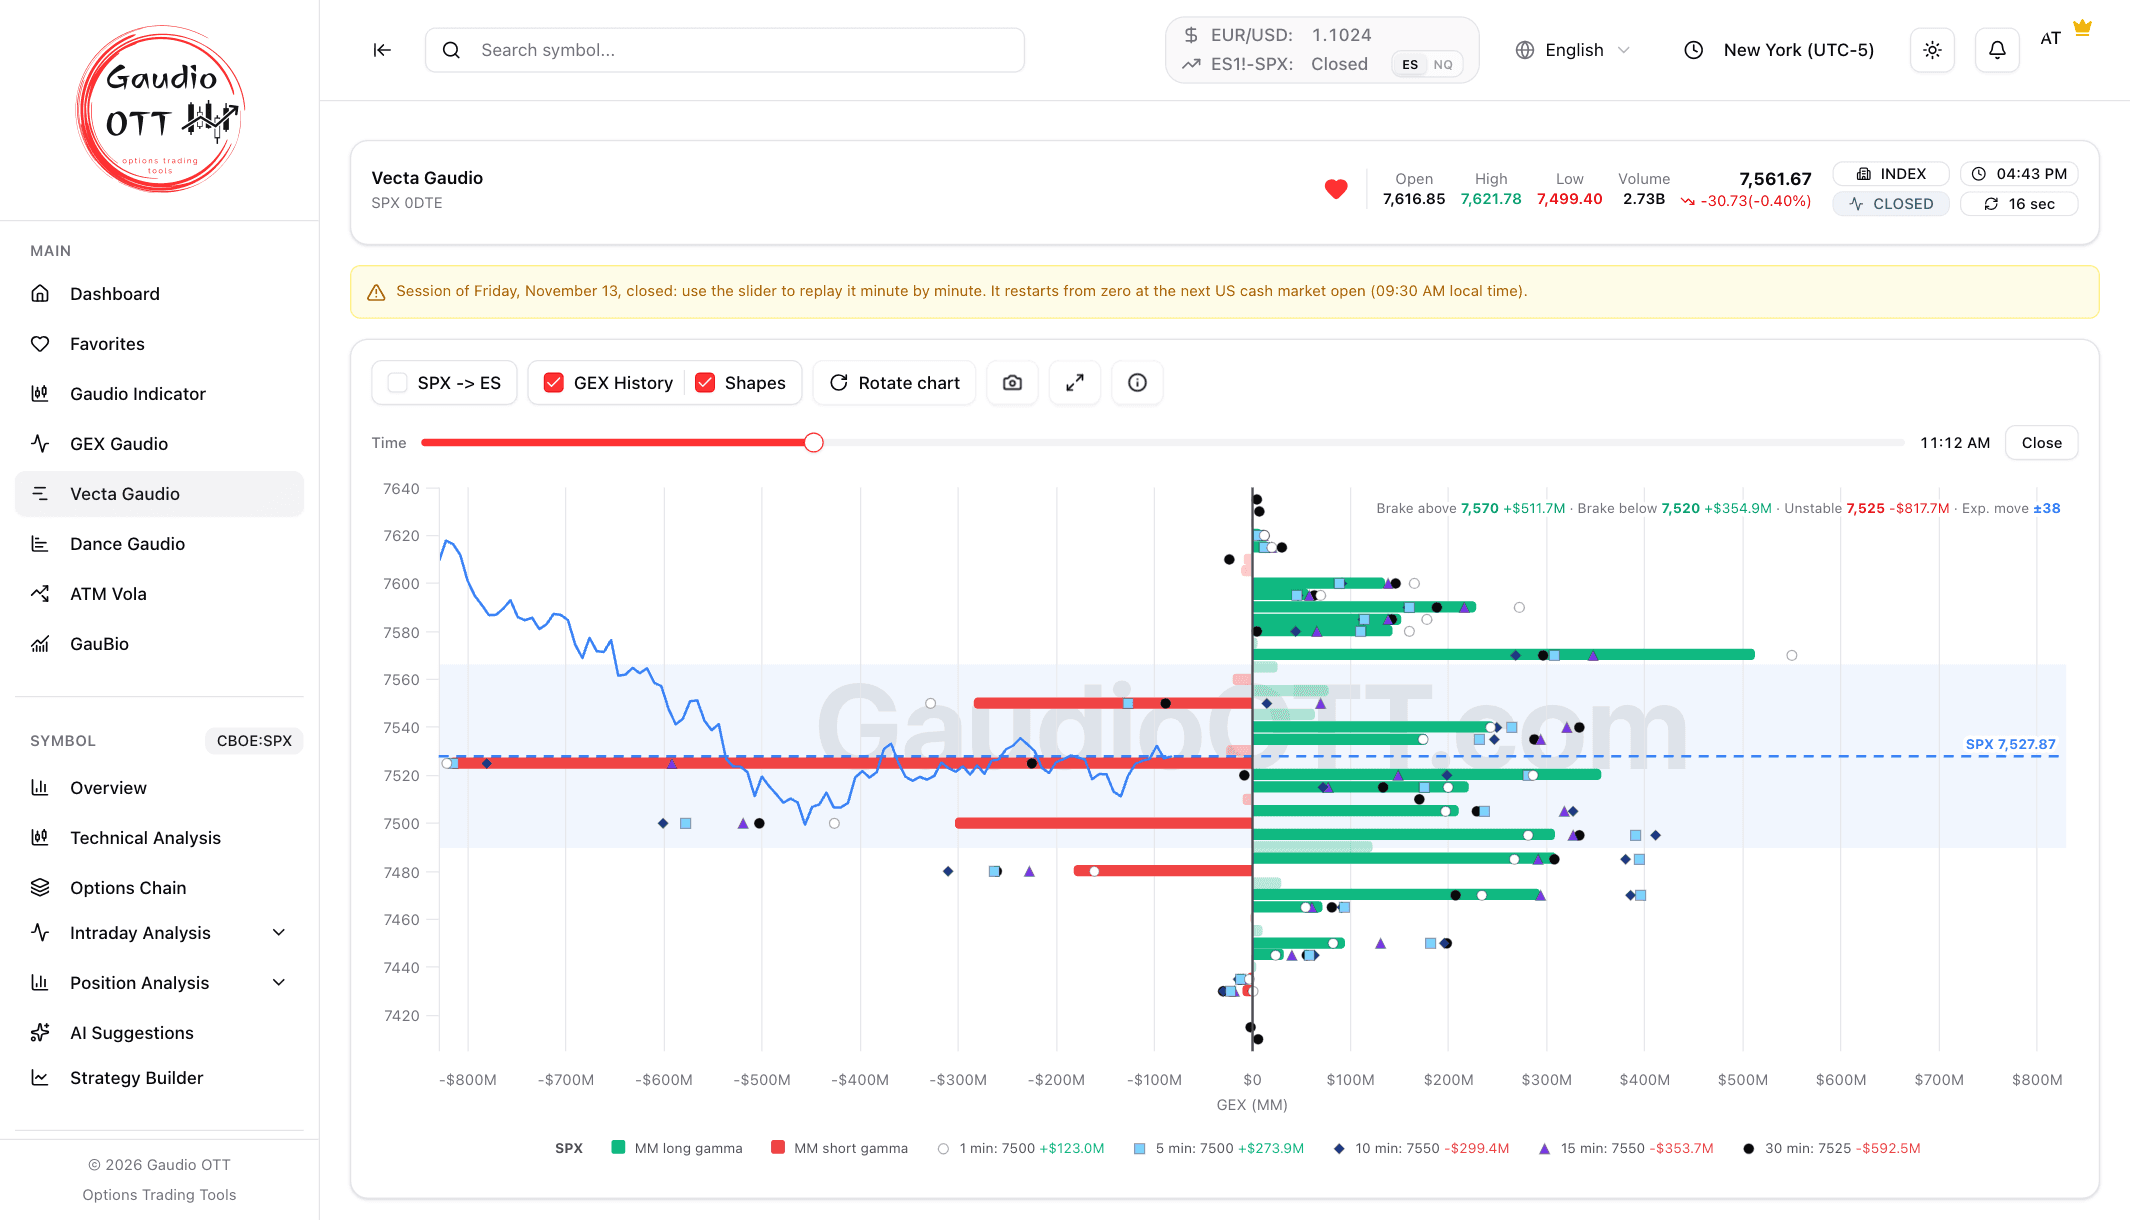
Vecta Gaudio: the market maker GEX on SPX 0DTE, strike by strike, with the price line, the expected move and the Brake above, Brake below and Unstable levels
How Gaudio OTT helps you
The sign from the session, not from an assumption
Green and red tell you whether market makers are long or short gamma on that strike according to today's trades, not according to a convention that holds on average.
Brakes and unstable zones, already found
Brake above, brake below and the unstable strike are written on the chart, with their GEX and the expected move to the close: you read them without scanning the profile.
The direction, not just the snapshot
The history dots show whether a brake is growing or fading, and whether a strike has changed colour in the last few minutes.
Concrete sizes, on ES too
Every bar tells you how many ES futures the hedge moves per SPX point, and with SPX -> ES strikes, bars and price move onto the future.
How to use market maker GEX
Knowing what kind of session it is
Green around price: hedging tends to hold it in the area, and moves fade. Red around price: hedging pushes in the direction of the move, and levels give way more easily.
Brakes as the day's support and resistance
The brake above and the brake below, better if inside the expected move, frame the area where price tends to slow down. A brake that is growing, with the bar beyond its dots, carries more weight.
Unstable zones to respect
The unstable strike is where a move can extend instead of stopping: a place not to put a tight stop, or where to expect an acceleration if price gets there.
Together with GEX Gaudio and Dance Gaudio
GEX Gaudio gives the classic gamma picture with the market maker levels, Dance Gaudio shows where 0DTE volume is moving now. When Vecta Gaudio confirms a level, that level carries more weight.
What makes Vecta Gaudio different
The GEX profiles you usually find, free or paid, all use the same convention about who holds calls and who holds puts, and often start from the previous evening's open interest, which misses the positions opened and closed during the day: on 0DTE, the bulk of the trading. Vecta Gaudio looks at the session in progress, on the options that expire today, and the sign of each strike comes from how the trading actually went.
It is a reading of the flow, and the page says so: bars that are not clear-cut yet are faded, and in the first half hour a badge reminds you that the picture is still building up. It is not a trading signal: it tells you what ground price is moving on, and the decision stays yours.
Frequently asked questions about market maker GEX
Learn more in the documentation
Read the guideRelated topics
AI Options Scanner
Two intelligent scanners — AI Suggestions on the symbol you're analyzing and the Opportunities Scanner on the entire US market — analyze thousands of contracts in real time across stocks, ETFs and futures, and show you only the trades with the best risk/reward profile.
GEX / Gamma Exposure
Two GEX tools — on open interest and on volume — for SPX, NDX, ETFs and stocks with options, plus the proprietary GEX Gaudio for intraday trading.
0DTE SPX
Dance Gaudio shows the volume of SPX options expiring today traded in the last minutes, strike by strike: the CALL level and the PUT level, the dominant side, the expected move and its decay into the close. During the session it updates on its own every minute.
Market Maker Levels
The Gaudio Indicator draws the day's market maker support and resistance and the previous session's reference price on a real-time chart of the ES and NQ futures, with volume and the proprietary Summa panel on the state of volatility.
Open Interest
See where positioning concentrates at every strike and expiry, to understand the levels the market defends.
Implied Volatility
Follow implied volatility as it moves: skew, term structure and ATM Vola across 0DTE, weekly and monthly expirations.
Options Chain
Browse the full options chain on stocks, ETFs and futures like ES and NQ: bid/ask premiums, Greeks and implied volatility for every strike and expiry. All you need is a free account: no paid plan, no credit card.
Strategy Builder
Build multi-leg strategies on real market prices, simulate price, time and volatility, and calculate profit and loss at any date, not just at expiry — with Greeks and breakeven, before you risk capital.
Market Movers
Six rankings over the thousand most traded names on NASDAQ, NYSE and AMEX, stocks and ETFs on separate tabs, with volume measured against what is normal for that time of day and movement measured against each name’s own habits. Every ticker opens the symbol with the full options analysis.
Technical Analysis
A full-height interactive chart on the symbol you are analysing, with volume, MA 200 and SuperTrend already on it, the complete indicator library, drawing tools and every timeframe. Included in every plan, the free one too.
See which side market makers are on today
Start the 7-day free trial on the monthly Ultra plan and open Vecta Gaudio: market maker GEX on SPX 0DTE, strike by strike, updated every minute.
Try it free for 7 daysStart analyzing options like a professional
Implied volatility, GEX, open interest and volume, proprietary indicators, AI Scanner and a multi-leg strategy builder: every options trading analysis tool in one platform.
Free plan, no credit card · 7-day trial on monthly plans · Cancel anytime
Questions?